In this blog post, you'll learn how to display data from a Microsoft SQL Server database in a Dixa conversation using the no-code/low-code tool FactBranch and Dixa's custom card feature. This allows you to seamlessly show data directly in the sidebar of your conversations. You can also watch this article as a step-by-step video guide, in which we set up everything in 6 minutes:
If you haven't done so already, create a FactBranch account: Visit factbranch.com and start your 14-day free trial. Once you've signed up for FactBranch, you'll be prompted to create your first Flow. Select "Show data in a Dixa Custom Card".
In FactBranch, data pipelines are triggered by specific events and process the data accordingly. In this case, the custom card in Dixa will trigger the data pipeline.
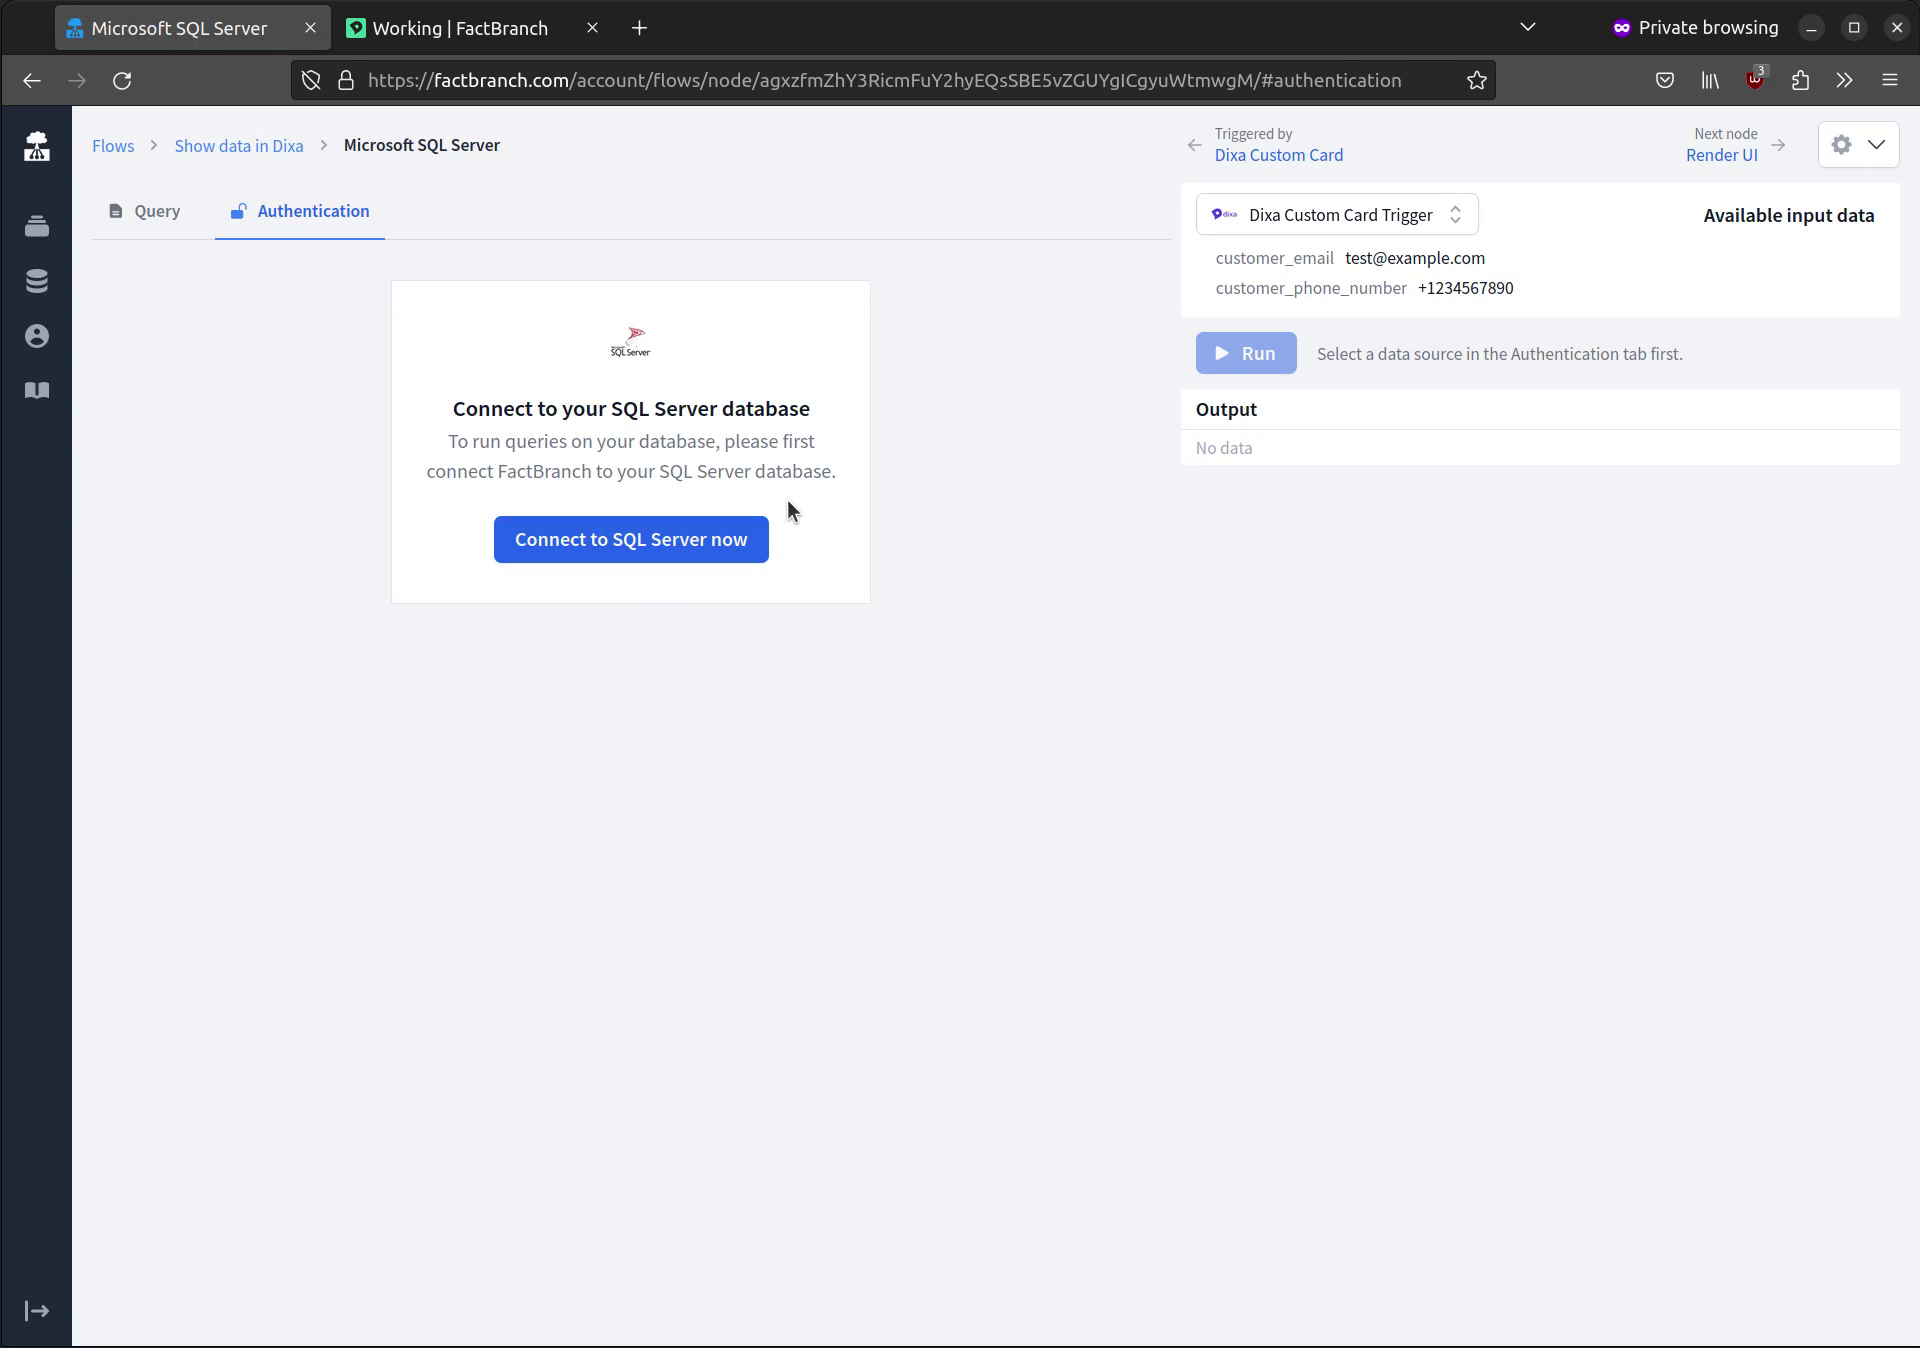
To fetch data from our MS SQL Server database, create a Microsoft SQL Server node. This node will run your query in your database.
Connect your SQL server by providing the necessary credentials. If your database is behind a firewall, you may need to activate "Use static IP" and allow access from FactBranch's IP address.
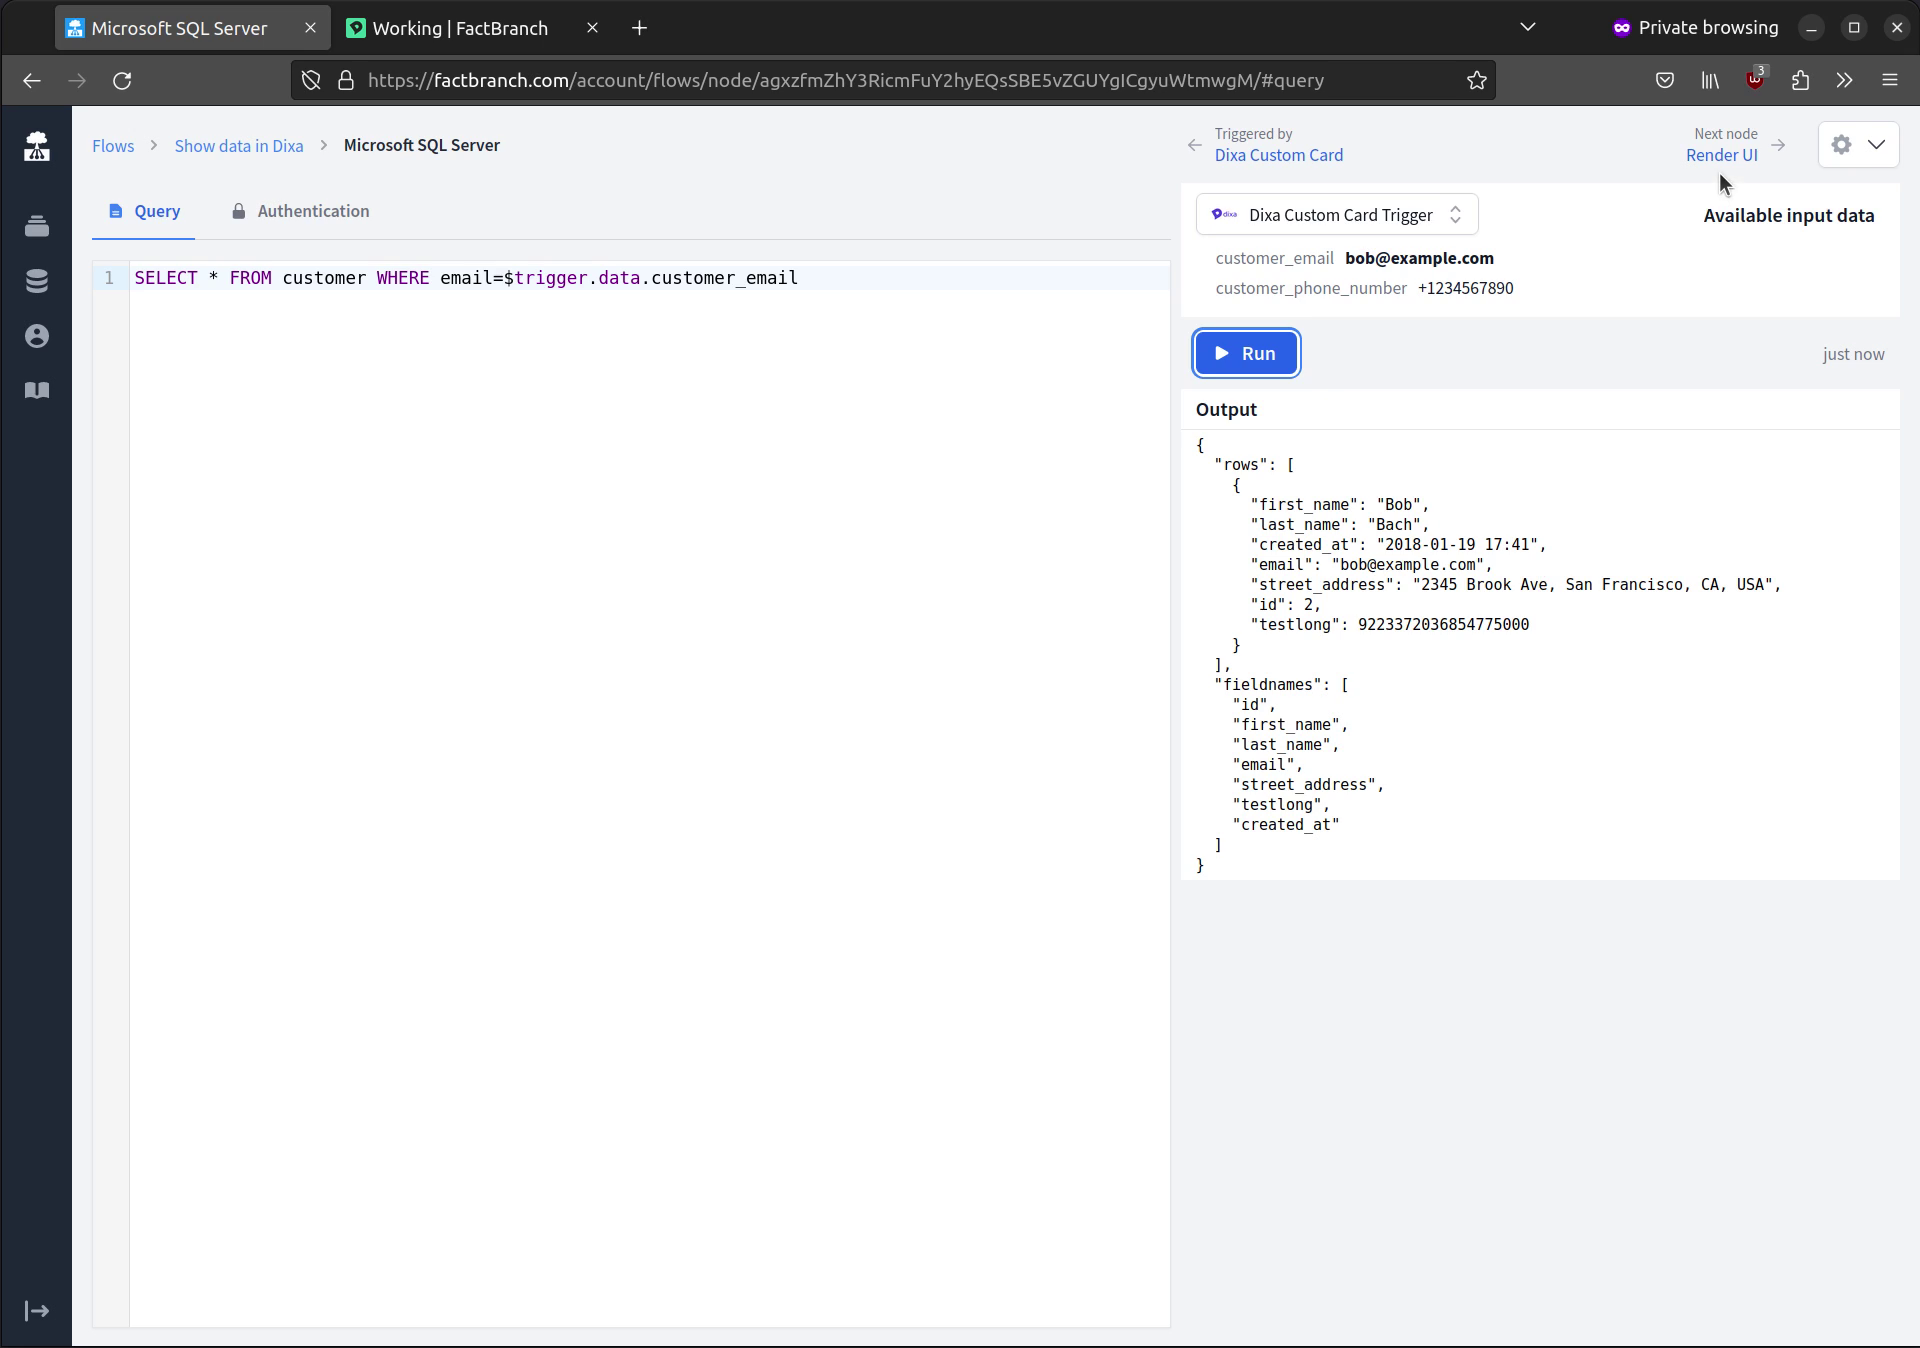
Write your query in the SQL Server node to retrieve the desired data from your database. You can use variables as placeholders to fetch data dynamically. For example, you can select all rows from the customer database where the email address matches the customer email received from the custom card in Dixa.
Test the query and ensure that it returns the expected results. If necessary, edit the test data to match the query conditions and your query returns at least one row of data.
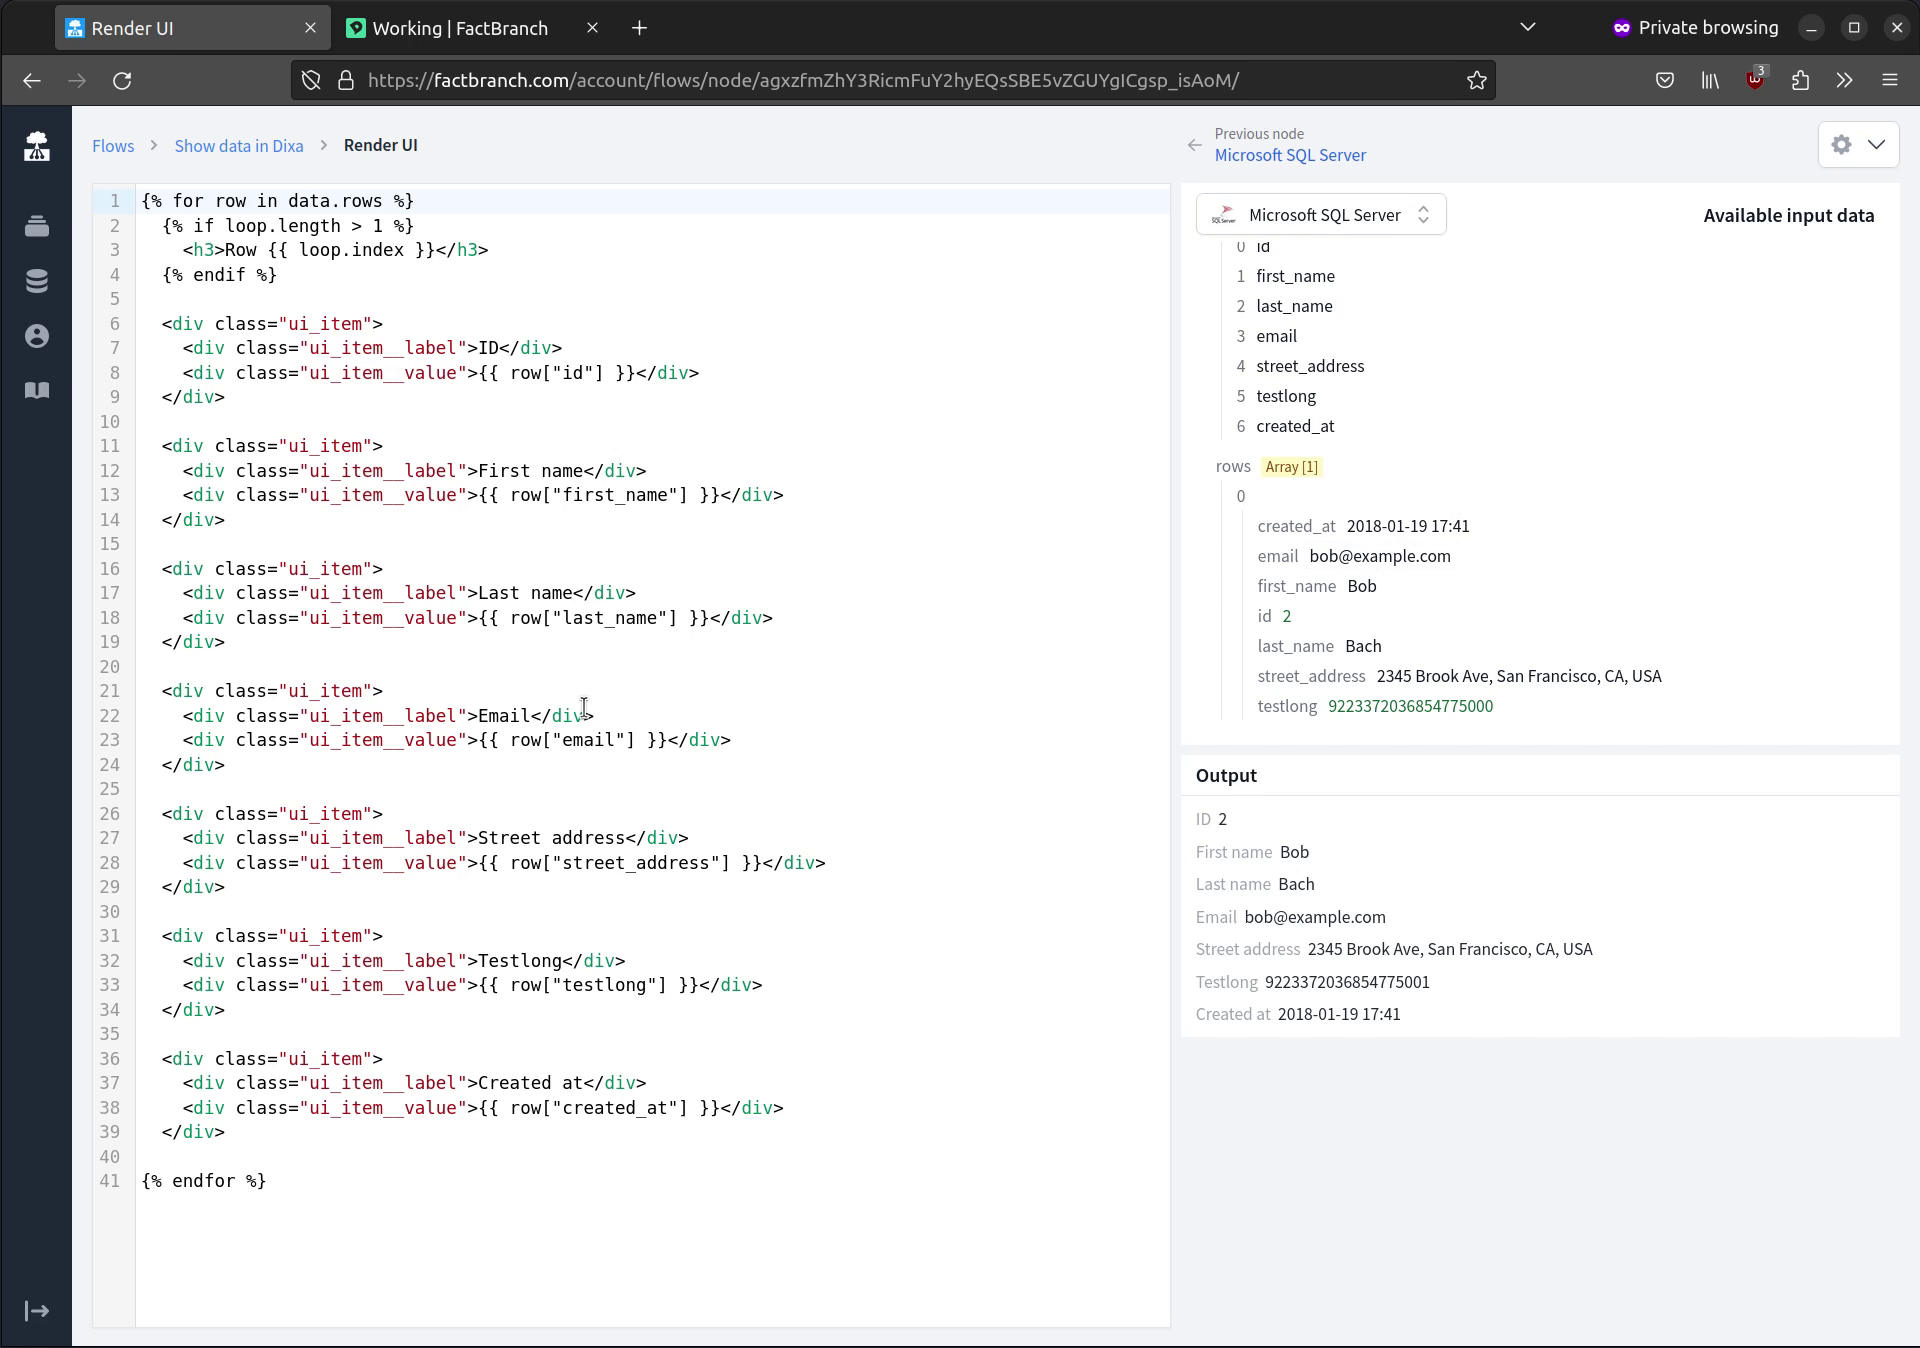
Once the SQL server node is configured, the data pipeline will pass the results to the "Render UI" node. Let's move on to the Render UI node now.
To help you get started with the UI template, FactBranch can generate a simple HTML GUI based on the data retrieved from the SQL Server node. But you can always edit the UI template to customize the display. FactBranch uses a templating language similar to Jinja2 or Liquid. Don't forget to check out more advanced template techniques in our docs.
The final step is to create a custom card in Dixa that will trigger the data pipeline and display the live data that FactBranch has collected.
Open the trigger configuration in FactBranch to find a guide on how to create the custom card in Dixa. Save the changes in Dixa.
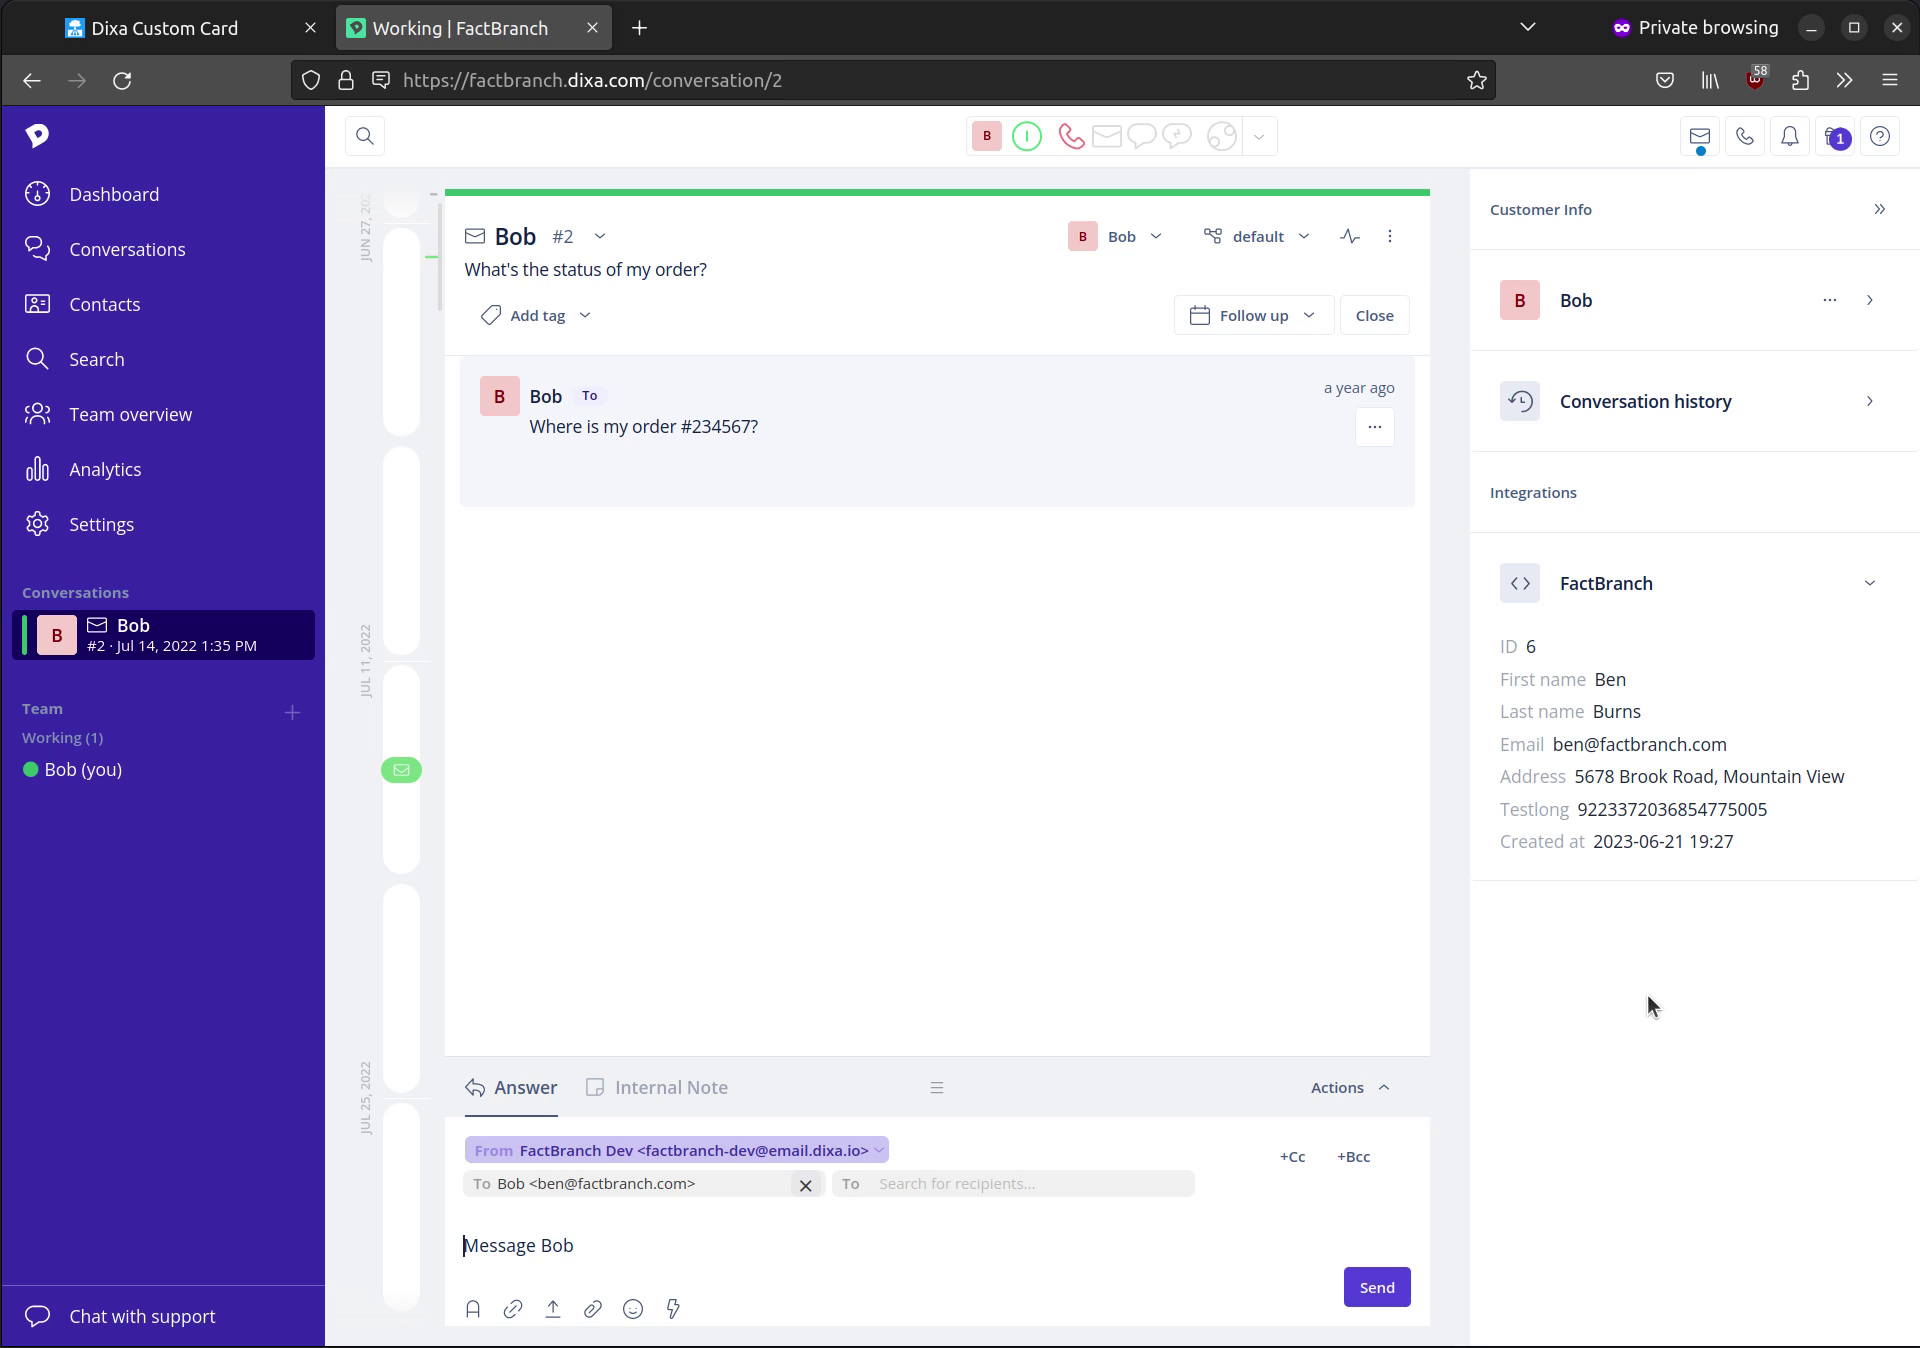
Now, when you open a conversation in Dixa, you will see the custom card you created, named "FactBranch," loading. It will fetch live data from your SQL database and display it in the sidebar next to the conversation.
Start your 14-day free trial of FactBranch today and make your agents' lives easier every day. If you have any questions, reach out to support@factbranch.com.
Sign up for our newsletter to get our freshest insights and product updates.
We care about the protection of your data. Read our Privacy Policy.